Question 1
Then find
")
Answer to Question 1:

See video (in two parts) for solution. Total run time about 9 minutes 30 seconds.
Part 1.
Part 2.
The following Figure shows the solution of the IVP from Question 1 plotted in (x, y) space.
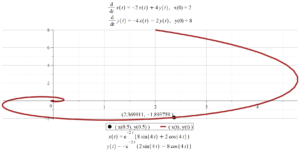
The following Maple commands will solve the IVP from Question 1 and create the above Figure.
You can copy and paste these commands into Maple.
with(plots):
a := -2:
b := 4:
c := -4:
d := -2:
x0 := 2:
y0 := 8:
tq := 0.5:
dex := diff(x(t), t) = a*x(t) + b*y(t);
dey := diff(y(t), t) = c*x(t) + d*y(t);
de := diff(x(t), t) = a*x(t) + b*y(t),
  diff(y(t), t) = c*x(t) + d*y(t):
de := dex, dey:
ics := x(0) = x0, y(0) = y0;
ans := dsolve([de, ics]):
ics;
ans[1];
ans[2];
evalf(subs(t = tq, ans[1]));
evalf(subs(t = tq, ans[2]));
xtq := rhs(evalf(subs(t = tq, ans[1]))):
ytq := rhs(evalf(subs(t = tq, ans[2]))):
xtq6dp := evalf(xtq, 7):
ytq6dp := evalf(ytq, 7):
PlotXY := plot([rhs(ans[1]), rhs(ans[2]), t = 0 .. 5],
  size = [0.7, 0.5], thickness = 8, gridlines, color = "brown",
  titlefont = ["TIMES", 24],
  title = typeset(dex, ",   x(0) = ", x0, " \n", dey, ",   y(0) = ", y0),
  captionfont = ["TIMES", 24],
  caption = typeset(ans[1], "\n", ans[2]),
  legend = [typeset(" ( x(t), y(t) )")],
  legendstyle = [font = ["TIMES", 24], location = bottom]):
PlotPt := plot([xtq], [ytq], style = point, symbolsize = 12,
  symbol = solidcircle, color = black,
  legend = [typeset(" ( x(", tq, "), y(", tq, ") )       ")],
  legendstyle = [font = ["TIMES", 24], location = bottom]):
plotText := textplot([xtq, ytq,
  typeset("(", xtq6dp, ", ", ytq6dp, " )")],
  align = {'above', 'left'}, font = ["TIMES", 24]):
display({PlotPt, PlotXY, plotText});

This entry is licensed under a Creative Commons Attribution-NonCommercial-ShareAlike 4.0 International license.