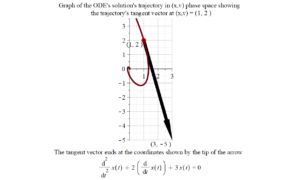
Question 1
 = (1, 2)")

Let

 = (\dot{x}, \dot{v})")
Find ")
Answer to Question 1:
 = (2, -7) \ }")
See video below for solution. Total run time about 3 minutes 25 seconds.
Graph for Question 1.
Important note.
We can easily find
")
")
")
")
 = (3, -5) - (1, 2) = (2, -7)")
Below are the Maple commands that created the above Figure (from Question 1).
You can copy and paste these commands into Maple.
with(plots):
with(VectorCalculus):
de := diff(x(t), t $ 2) + 2*diff(x(t), t $ 1) + 3*x(t) = 0;
xdot := (x, v) ->  v;
vdot := (x, v) -> -3*x - 2*v;
ics := x(0) = 1, D(x)(0) = 2;
SolutionIVP := dsolve({de, ics}):
xfun := t -> rhs(SolutionIVP):
x0 := rhs(ics[1]);
v0 := rhs(ics[2]);
"Tangent Vector";
Tx0 := xdot(x0, v0);
Tv0 := vdot(x0, v0);
EndTx0 := x0 + Tx0:
EndTv0 := v0 + Tv0:
plotA := plot([rhs(SolutionIVP), D(xfun)(t), t = -0.2 .. 12.6],
   thickness = 6, size = [0.5, 0.6], gridlines,
   scaling = constrained,
   title = typeset("Graph of the ODE's solution's trajectory in (x,v) phase space showing \n the trajectory's tangent vector at (x,v) = (", x0, ", ", v0, " )"),
   caption = typeset("The tangent vector ends at the coordinates shown by the tip of the arrow \n ", de)):
plotB := pointplot([[rhs(ics[1]), rhs(ics[2])]], color = [red],
    symbol = solidcircle, symbolsize = 15):
plotC := textplot([rhs(ics[1]), rhs(ics[2]),
   typeset("(", x0, ", ", v0, " )")], align = {'below', 'left'}):
plotD := textplot([EndTx0, EndTv0, typeset("(", EndTx0, ", ", EndTv0, " )")], align = {'below', 'left'}):
vs1 := VectorSpace('cartesian', [0, 0]):
vs2 := VectorSpace('cartesian', [x0, v0]):
plotE := PlotVector([vs2:-Vector([Tx0, Tv0])], width = 0.2):
display({plotA, plotB, plotC, plotD, plotE});

This entry is licensed under a Creative Commons Attribution-NonCommercial-ShareAlike 4.0 International license.