Question 1

 = 3")
Solve the above IVP and then find
")
Answer to Question 1:

See video below for solution. Total run time 2 minutes 53 seconds.
Question 2
")
 = 3")
Solve the above IVP and then find
Answer to Question 2:
See video and graph below for solution. Total run time about 3 minutes 32 seconds.
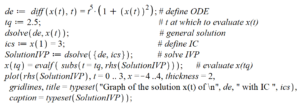
Below are the Maple commands to solve the IVP in Question 2 and create the above Figure. You should not copy and paste these commands into Maple (as of January 2023).
Instead please use the new version of this code directly beneath it.
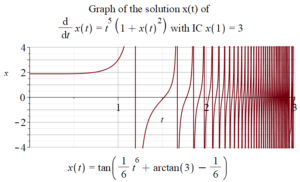
 de := diff(x(t), t) = t^5*(1 + x(t)^2);
tq := 2.5;
dsolve(de, x(t));
ics := x(1) = 3;
SolutionIVP := dsolve({de, ics});
x(tq) = evalf(subs(t = tq, rhs(SolutionIVP)));
plot(rhs(SolutionIVP), t = 0 .. 3, x = -4 .. 4, thickness = 2,
  size = [0.5, 0.6], gridlines,
  title = typeset("Graph of the solution x(t) of \n", de, " with IC ", ics),
  caption = typeset(SolutionIVP));
Update January 2023. New version of the above Maple code follows. You can copy the following code into Maple and run it. The graph might look a little different than what is in the video for Question 2, but the code runs fine.
 de := diff(x(t), t) = t^5*(1 + x(t)^2);
tq := 2.5;
dsolve(de, x(t));
ics := x(1) = 3;
SolutionIVP := dsolve({de, ics}); x(tq) = evalf(subs(t = tq, rhs(SolutionIVP)));
plot(rhs(SolutionIVP), t = 0 .. 3, x = -4 .. 4, thickness = 2, size = [0.5, 0.6], gridlines, title = typeset("Graph of the solution x(t) of \n", de, " with IC ", ics), caption = typeset(SolutionIVP));
# End code
Below is a screen capture of above commands in Maple.
Matlab Solution to Question 2
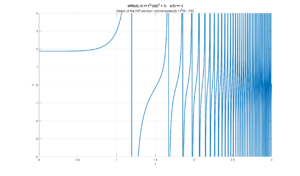
Below are the Matlab commands to solve the IVP in Question 2 and create the above Figure. You can copy and paste these commands into Matlab.
syms x(t);
Dx = diff(x,t);
ode = diff(x,t,1) == t^5*(1 + x(t)^2)
cond1 = x(1) == 3;
conds = [cond1];
xSol(t) = dsolve(ode,conds)
tq = 2.5
eval(subs(xSol(t),t,tq))
tt = 0: .001: 3;
xx = eval(xSol(tt));
figure
plot(tt,xx, 'LineWidth',2)
ylim([-4 4])
grid on
title(strcat(string(ode), "    " , string(conds) ) , strcat("Graph of the IVP solution: x(t)=",string(xSol(t))) )
xlabel('t')
ylabel('x')

This entry is licensed under a Creative Commons Attribution-NonCommercial-ShareAlike 4.0 International license.